Beyond %

a practical guide to coverage metrics (and when to ignore them)

Ivan Ponomarev

The Problem

  • In the modern world, both code and tests are cheap

  • We need a way to measure the quality of our tests.

The magical “code coverage” metric

  • “What’s the test/code coverage in your project?”

  • “We have very high, 80%..90% test coverage”

  • “We need to improve coverage!”

  • “Can you give us 100% test coverage?”

The magical “code coverage” metric

  • “What’s the test/code coverage in your project?”

  • “We have very high, 80%..90% test coverage”

  • “We need to improve coverage!”

  • “Can you give us 100% test coverage?”

target
ivan

Ivan Ponomarev

  • Team Lead at Synthesized.io (test data automation you can trust!)

  • Teaching CS and programming at universities

Line coverage (C0)

assertThat(new Pair(3, 2).maxComponent()).isEqualTo(3);
if (x > y)
   return x;
else
   return x;
  • ✅ Covered: 2

  • ⛔ Uncovered: 2

  • Line coverage: 50%

Line coverage

assertThat(new Pair(3, 2).maxComponent()).isEqualTo(3);
if (x > y) {
   return
          this
          .
          x;
} else { return x;}
  • ✅ Covered: 5

  • ⛔ Uncovered: 1

  • Line coverage: 83%

Instruction Coverage (e. g. in JaCoCo)

Instruction coverage provides information about the number of instructions
that has been executed or missed.
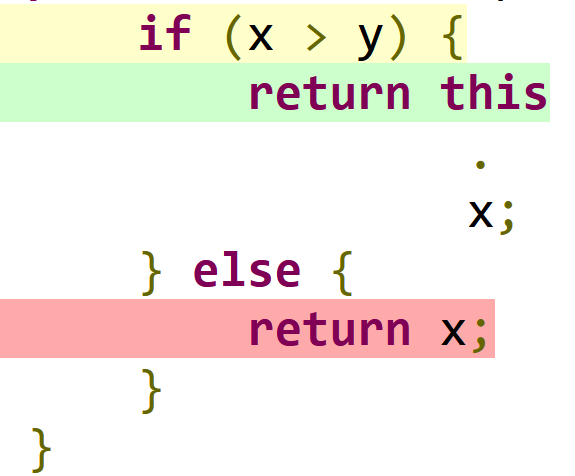
jacoco instructions 1
jacoco instructions 2
  • Independent of source formatting

  • Always available, even in absence of debug information/source code.

And yet!

logger.info("Calculating max component");
  if (x > y) {
    logger.info("x > y, so the maximum is x!");
    System.gc(); // because why not
    ohByTheWay();
    andMore();
    return x;
  } else {
    return x;
}
  • ✅ Covered: 6

  • ⛔ Uncovered: 1

  • Line coverage: 86%

  • JaCoCo measures this as 89% instruction coverage

Lessons learned

  • C0 (LOC/instruction) coverage is a weak metric: it can change without any real improvement in test quality.

  • Yet in practice, most projects still use this metric as their primary definition of code coverage.

  • My hypothesis: because it produces higher percentages.

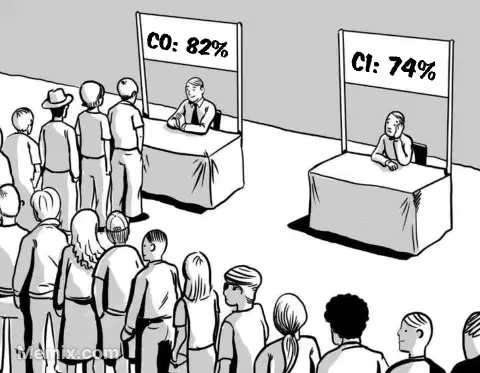
meme queue

C1 coverage: branch coverage

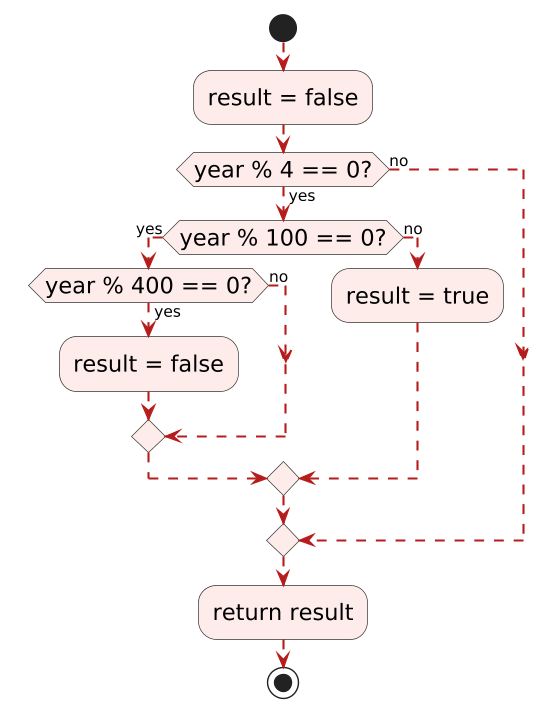
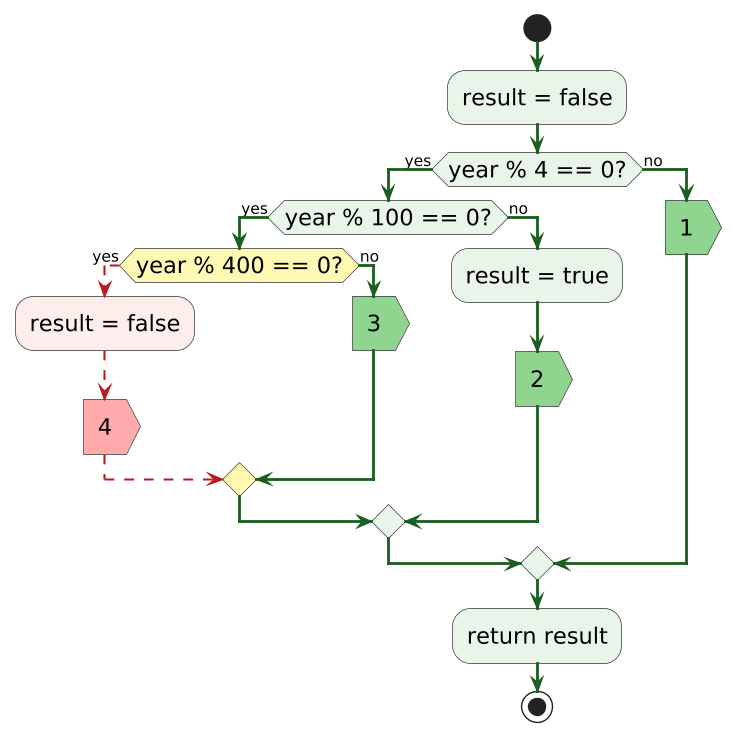
  • Every year that is exactly divisible by four is a leap year,

  • except for years that are exactly divisible by 100,

  • but these centurial years are leap years if they are exactly divisible by 400

boolean isLeapYear(int year) { ... }
leap

Method under test: IsLeapYear

leapyear04

How many examples should we consider in order to reliably test this method?
(Given that we trust the % operation.)

IsLeapYear: Code instrumentation

leapyear00
Diagram

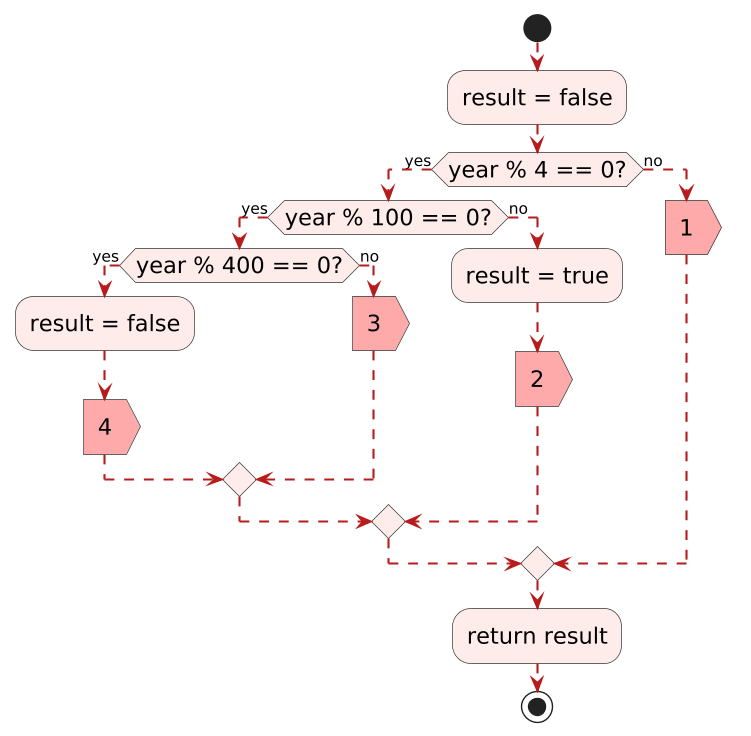
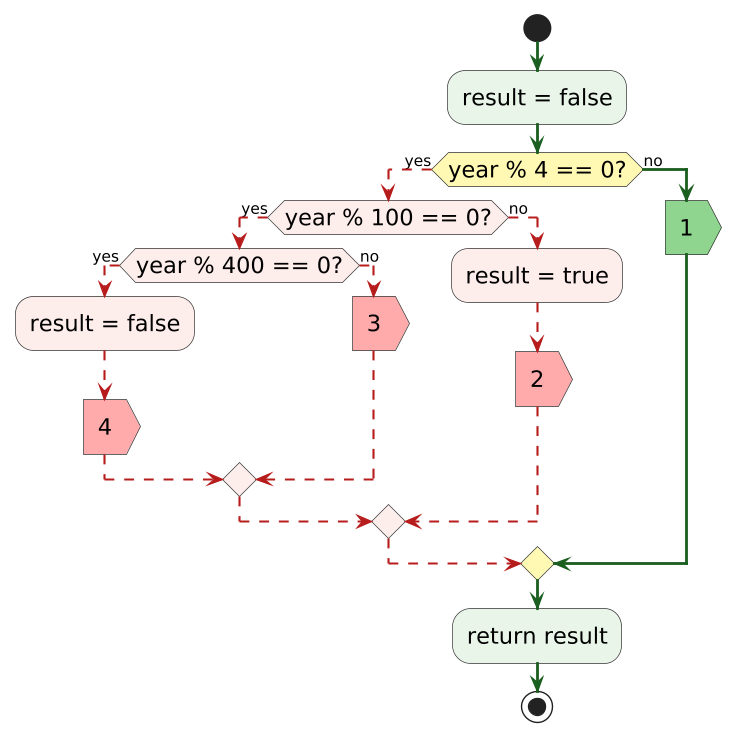
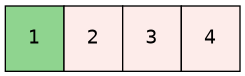
IsLeapYear: Branch coverage 25%

leapyear15
Diagram
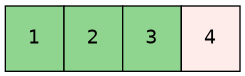
  • 2026 (non-divisible by 4) — false

  • Branch coverage: 25%

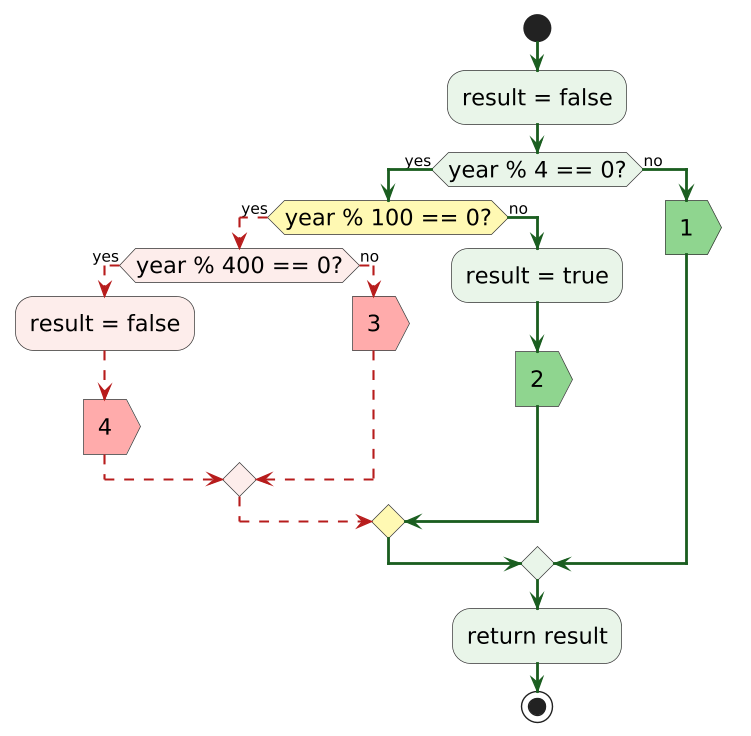
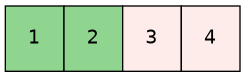
IsLeapYear: Branch coverage 50%

leapyear25
Diagram
  • 2026 (non-divisible by 4) — false

  • 2028 (divisible by 4, not centennial) — true

  • 99% of all the years fall in two categories above.

  • Branch coverage: 50%

IsLeapYear: Branch coverage 75%

leapyear35
Diagram
  • 2026 (non-divisible by 4) — false

  • 2028 (divisible by 4, not centennial) — true

  • 2100 (centennial, but not divisible by 400) — false

  • Only 1 year out 400, or 0.25% will fall into the remaining category. Yet the branch coverage is 75%.

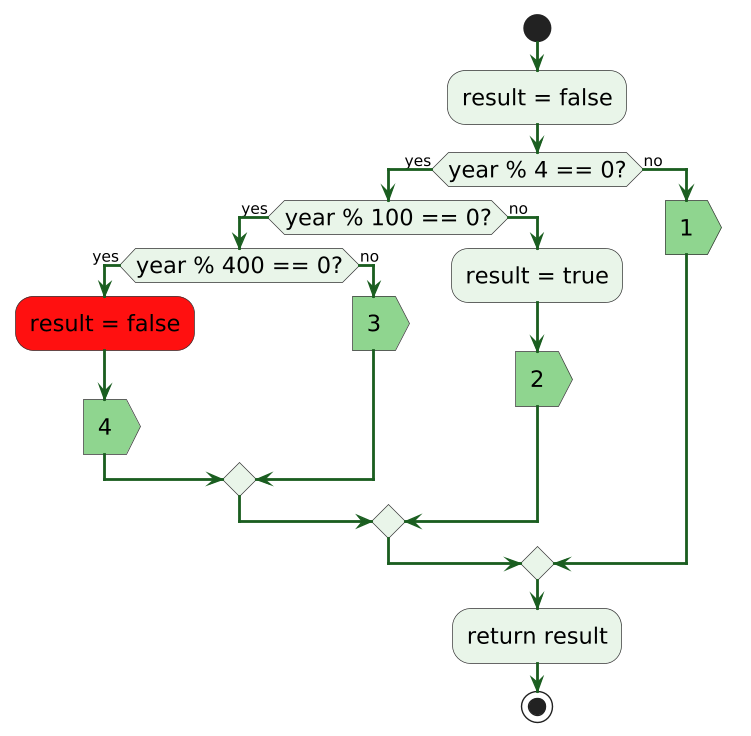
IsLeapYear: Branch coverage 100%

leapyear45
Diagram
  • 2026 (non-divisible by 4) — false

  • 2028 (divisible by 4, not centennial) — true

  • 2100 (centennial, but not divisible by 400) — false

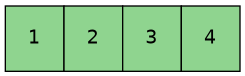
  • 2000 (centennial, divisible by 400) — expected true, was false, bug spotted

Lessons learned

jacoco branch 50
  • Branch coverage (С1) doesn’t depend on the "length" of the branches — every decision point brings equal weight to the calculation of %.

  • This gives more pessimistic %, but this is actually healthier for the project (we’ll get to it).

  • My advice: switch from measuring line/instruction coverage to branch coverage now.

Graph metrics
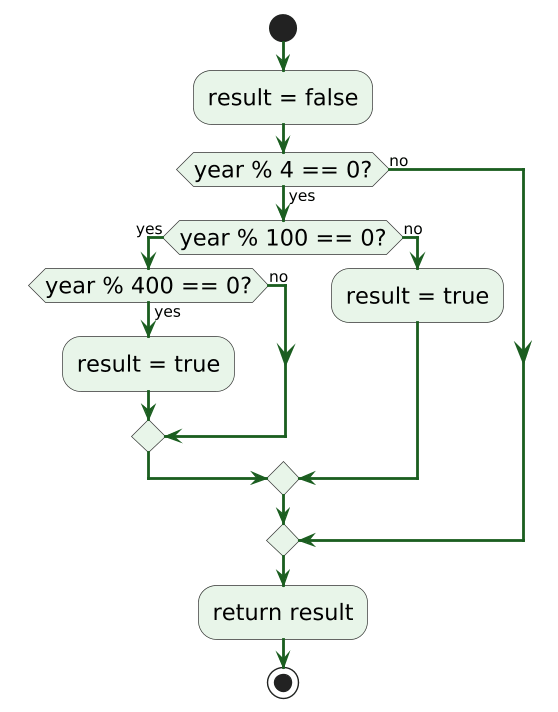
leapyear95
  • Number of branches number of execution paths needed to cover all the edges: 4

  • Number of paths number of all possible execution paths: 4

  • Cyclomatic complexity
    CC = E - N + 2 = 14 - 12 + 2 = 4

All of them are 4 for this method, but it’s just a coincidence!

Adding extra statements to a branch does not contribute to CC…

a

For a chain of statements without any decision points, CC = 1 no matter how long is the chain!!

E - N + 2 = 2 - 3 + 2 = 1

Adding extra statements to a branch does not contribute to CC…

a
ab
abc

For a chain of statements without any decision points, CC = 1 no matter how long is the chain!!

E - N + 2 = 2 - 3 + 2 = 3 - 4 + 2 = 4 - 5 + 2 = 1

(we add +1 edge and +1 node)

…Adding “decision points” do contribute
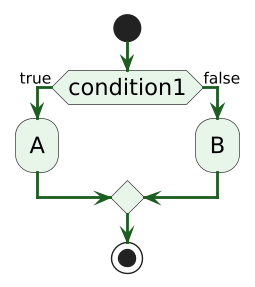
oneif

if, while, for, switch case, also all the boolean expressions with short-cutting (&&, ||) will add +1 to CC

CC = E - N + 2 = 6 - 6 + 2 = 2

…Adding “decision points” do contribute
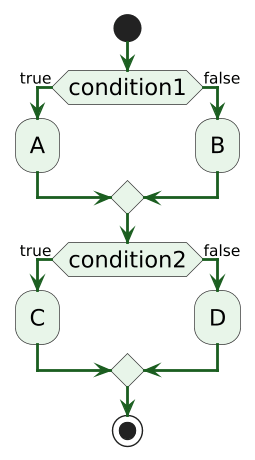
twoifs1

if, while, for, switch case, also all the boolean expressions with short-cutting (&&, ||) will add +1 to CC

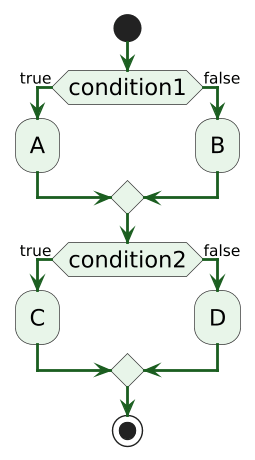
CC = E - N + 2 = 11 - 10 + 2 = 3

Mathematical fact (according to Wikipedia)
twoifs

Cyclomatic complexity
(3 in this case) is

  • the upper bound for the number of test cases that are necessary to achieve a complete branch coverage
    (2 in this case, e.g.: AC, BD)

  • the lower bound for the number of paths through the control-flow graph
    (4 in this case: AC, AD, BC, BD)

Cyclomatic Complexity metric

  • Introduced by Thomas J. McCabe in 1976.

  • It’s very easy to calculate for every programming language (only very basic lexical/syntax analysis is needed). On the other hand, estimation of actual possible paths of execution involves analysis of “possible” and “impossible” paths.

  • It’s additive (we can calculate CC for a whole project).

  • It’s “roughly the number of unit tests needed”.

What is an acceptable value for CC?

  • MCabe’s categorization of CC of a single procedure (2008 PowerPoint deck→Wikipedia):

    • 1 - 10: Simple procedure, little risk

    • 11 - 20: More complex, moderate risk

    • 21 - 50: Complex, high risk

    • > 50: Untestable code, very high risk

  • My own categorization (Ivan Ponomarev, 2026):

    • 1 - 15 OK

    • > 15 mess, if it’s deterministically generated code — refactor

Lessons learned

  • Cyclomatic complexity is a very easy to calculate metric, available for most languages.

  • Set up a gate for CC for no more than 15 per method in order to reduce bugs and surface problematic places in the code.

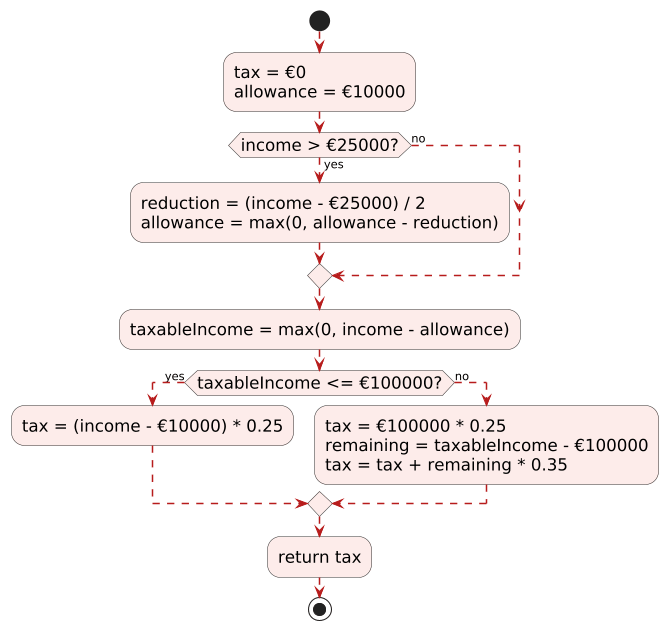
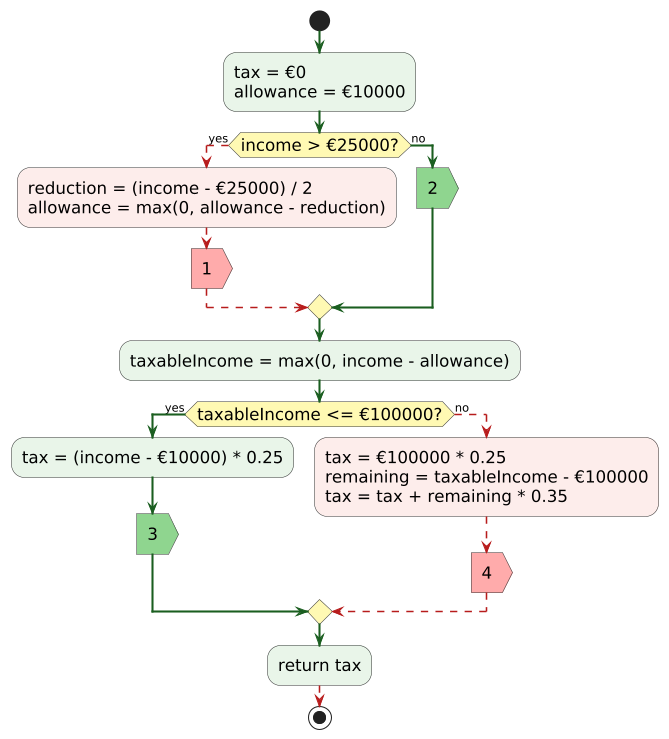
A fictitious country’s income tax system

  • Untaxable yearly allowance is €10000.

  • However, if yearly income is more than €25000, each exceeding euro decreases the allowance by €0.5.

  • The 25% tax is taken from the taxable amount
    (income - allowance).

  • If taxable amount is more than €100000, the exceeding amount is taxed at 35%.

long tax(long income) { ... }
tax

Let’s test!

tax

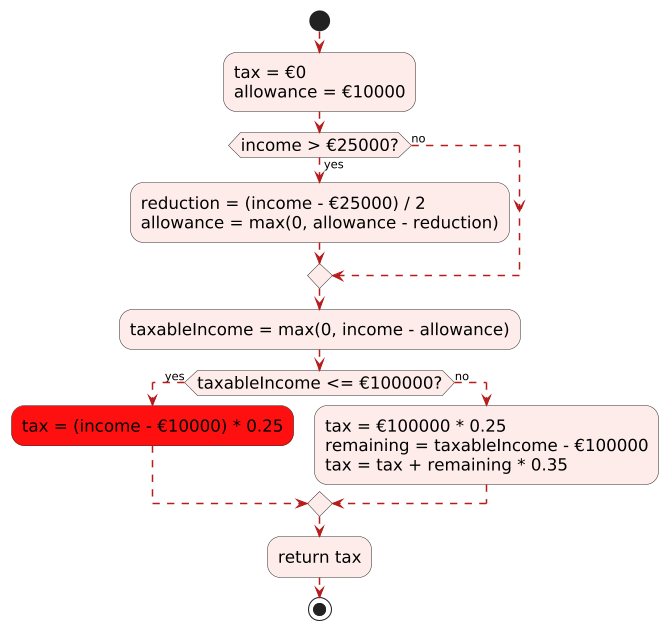
The bug

tax bug

Wrong code:

(income - €10000) * 0.25

instead of

taxableIncome * 0.25

Let’s test: add instrumentation

tax instrumented
Diagram
Diagram

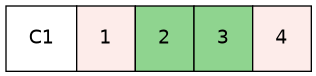
Let’s test: 50% branch coverage

tax50
Diagram
Diagram
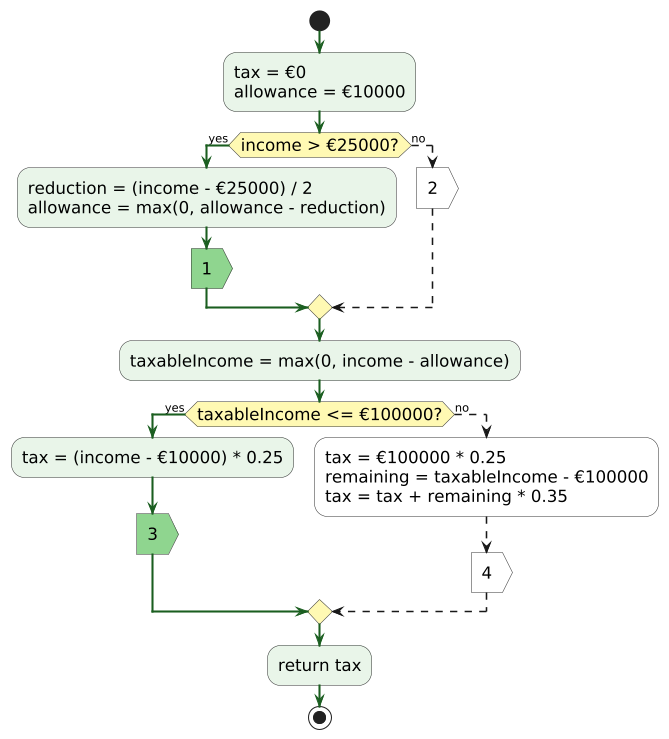
  • Income: €12000, tax: €500 (no allowance deduction, no higher rate)

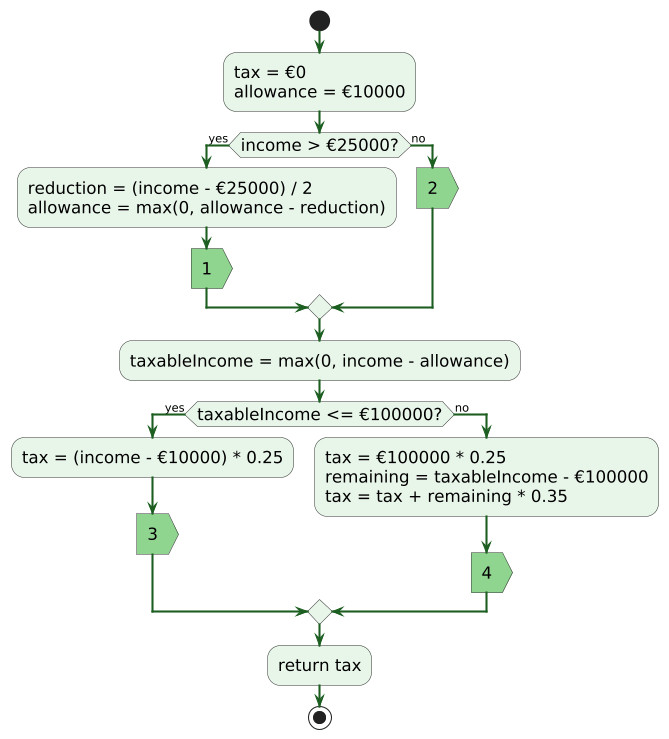
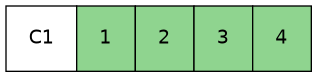
Let’s test: 100% branch coverage

tax100
Diagram
Diagram
  • Income: €12000, tax: €500 (no allowance deduction, no higher rate)

  • Income: €200000, tax: €60000 (allowance deduction, higher rate)

  • Branch coverage 100%, are we done testing?

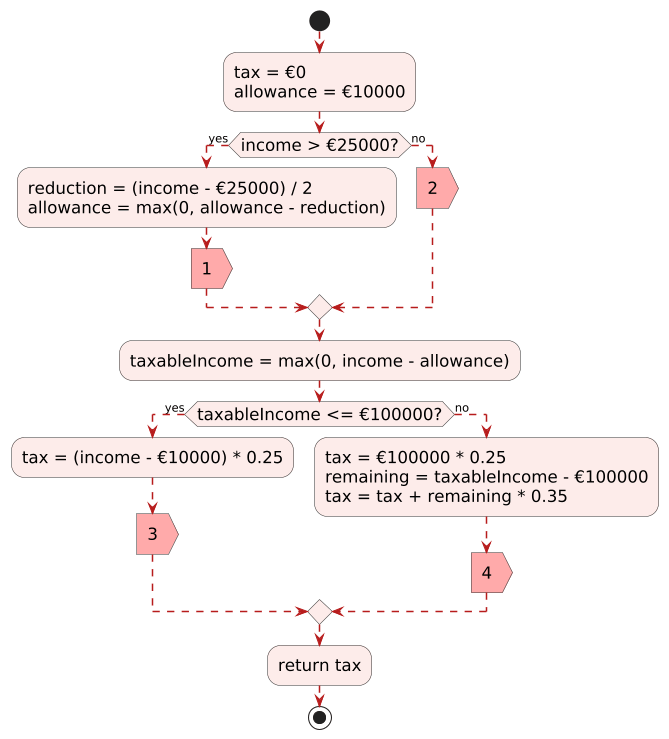
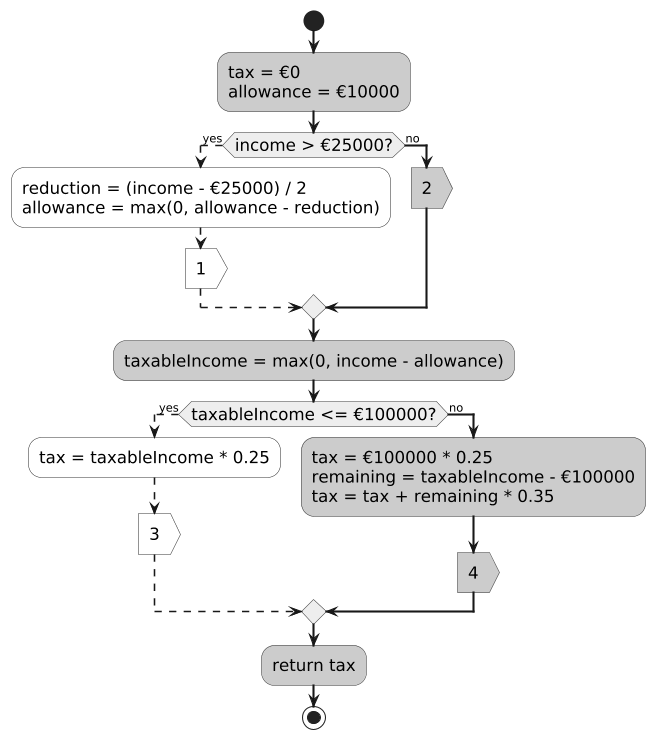
Missed execution path

tax missed
Diagram
Diagram
  • Income: €30000, expected tax: €5625 (allowance deduction, no higher rate)

  • Actual result: €5000 — bug spotted

Logically impossible execution path

tax impossible
Diagram
Diagram
  • No allowance deduction + higher rate path is not logically possible: the income for higher rate is bigger than the income that requires allowance deduction

  • "Full execution path coverage" requires both path tracking + analysis of possible & impossible paths. Your ordinary code coverage tool doesn’t do that.

Lessons learned

  • Full branch coverage (C1) does not imply full execution paths coverage (C2) and thus may oversee bugs.

  • C2 is difficult to measure and ordinary tools do not measure C2.

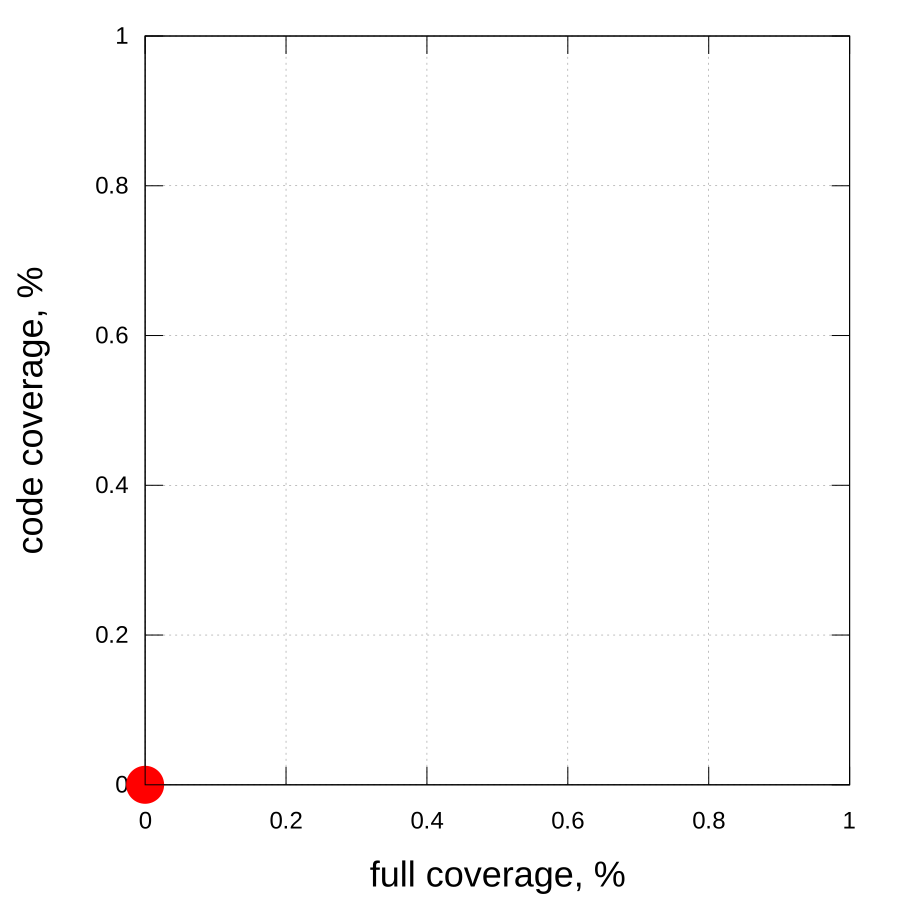
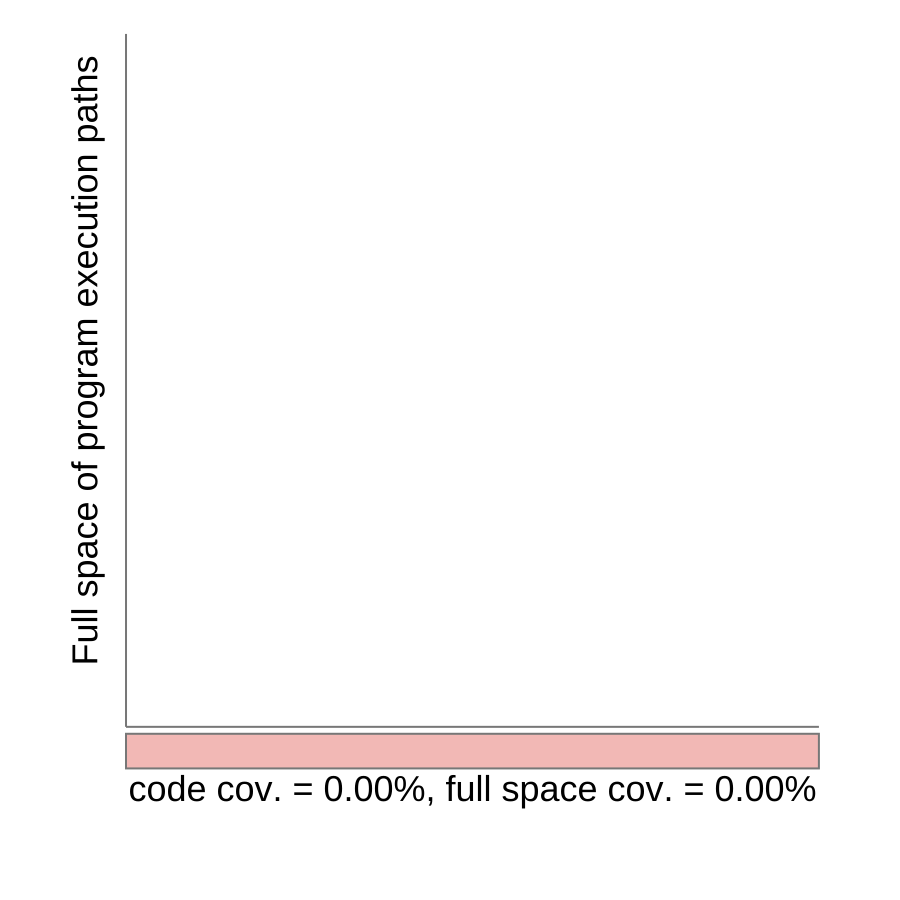
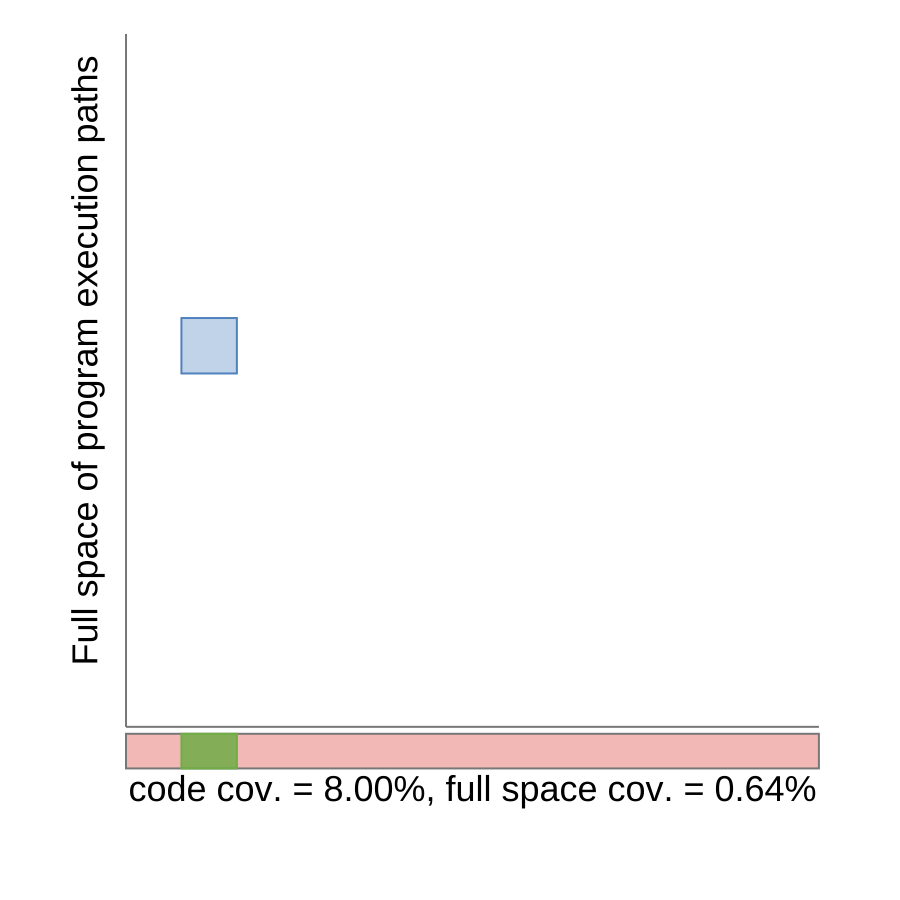
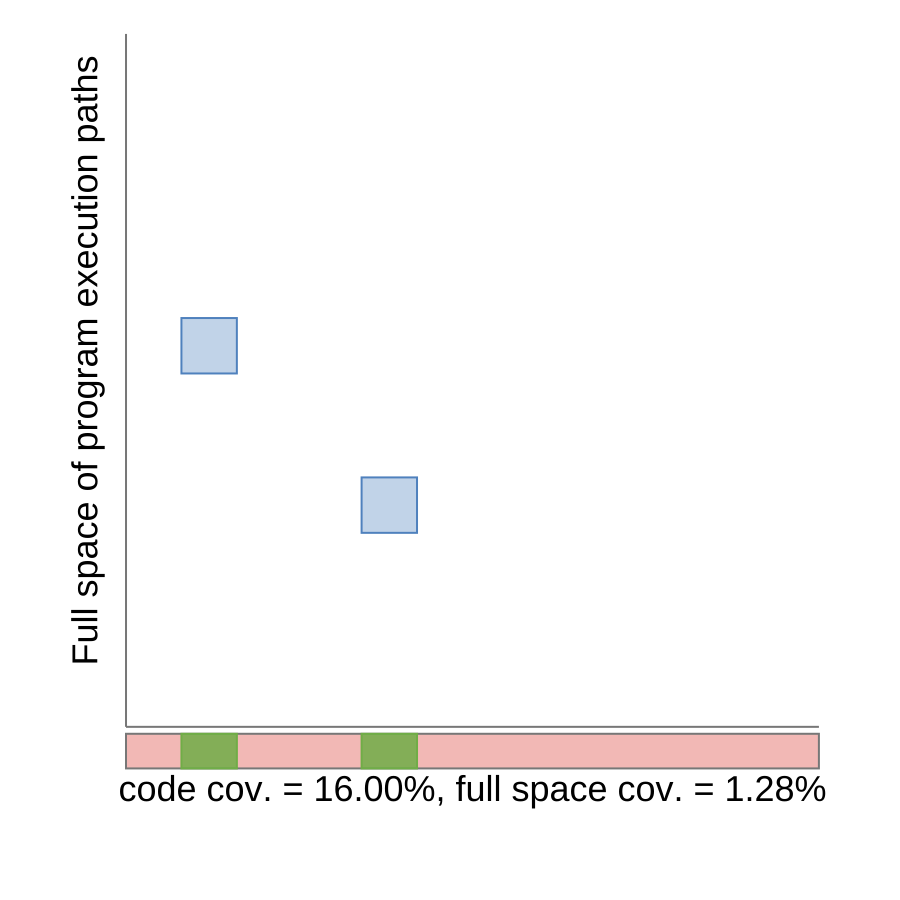
C0/C1 coverage is just a uni-dimensional projection
of multidimensional picture
coverage 01
coverage plot 01

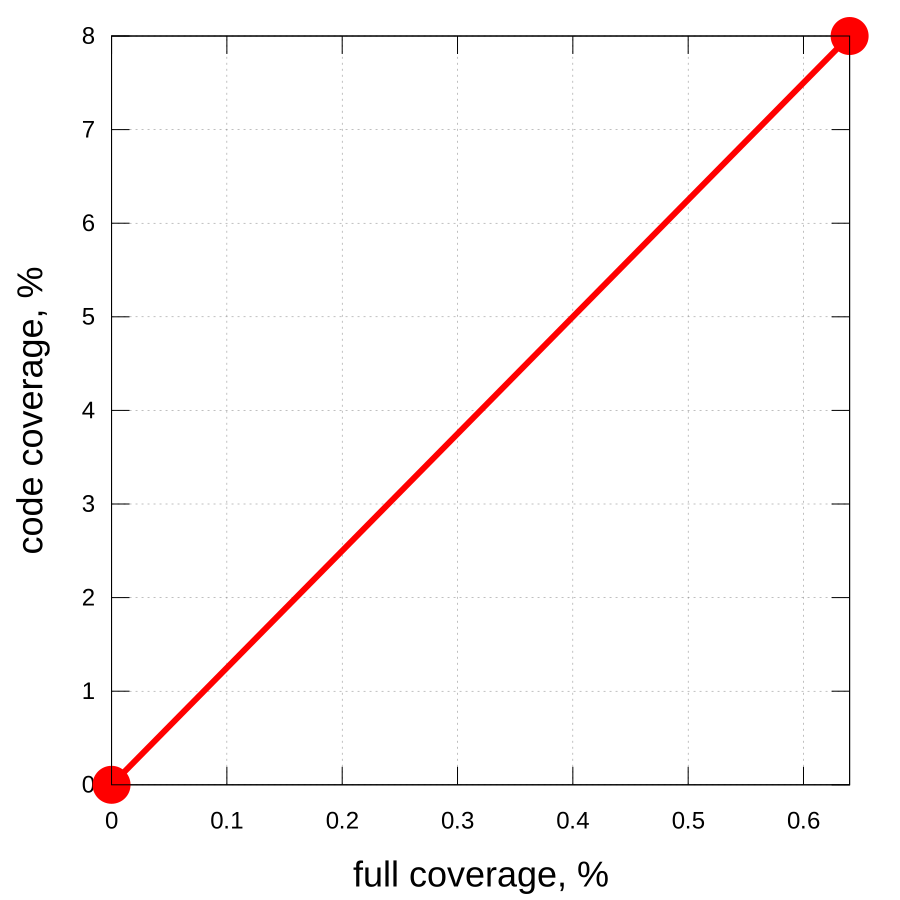
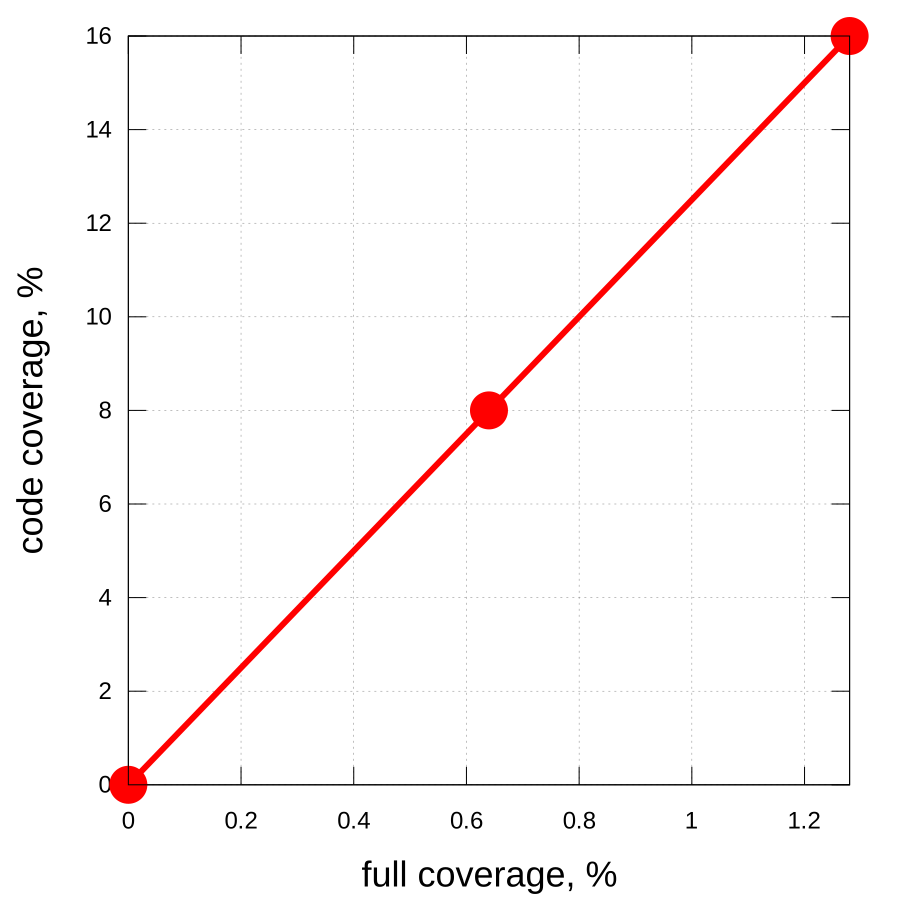
Low C0/C1 coverage: increase of code coverage
reflects the increase of tests quality
coverage 02
coverage plot 02

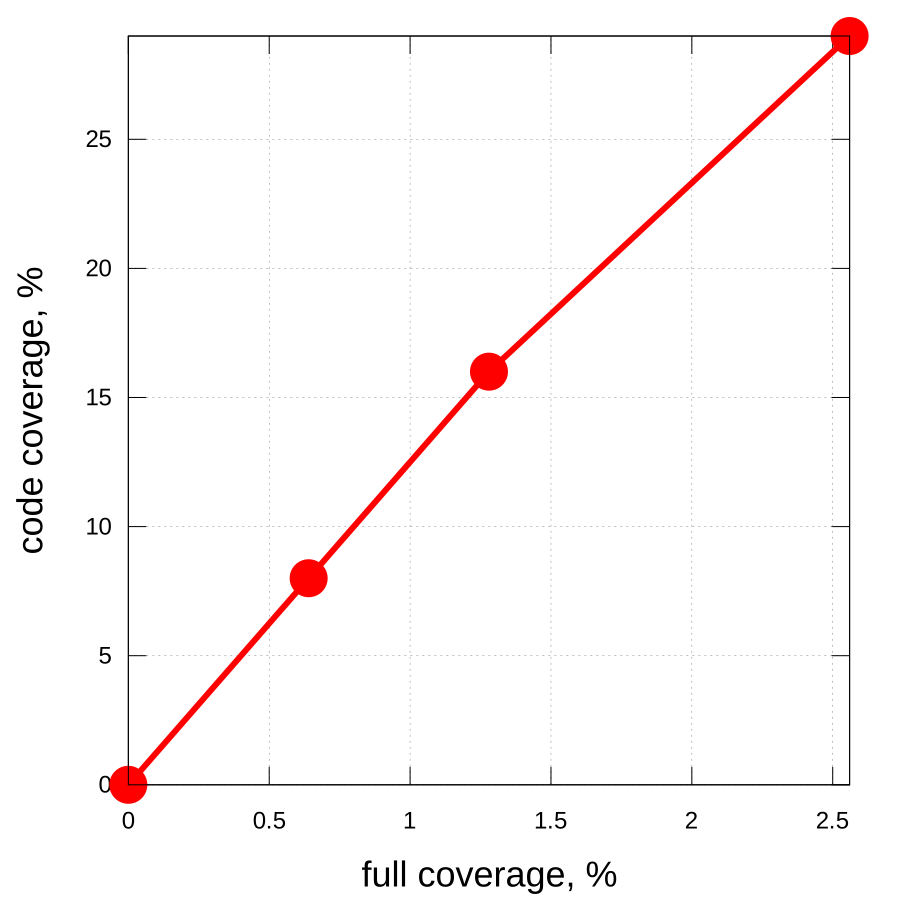
Low C0/C1 coverage: increase of code coverage
reflects the increase of tests quality
coverage 03
coverage plot 03

Low C0/C1 coverage: increase of code coverage
reflects the increase of tests quality
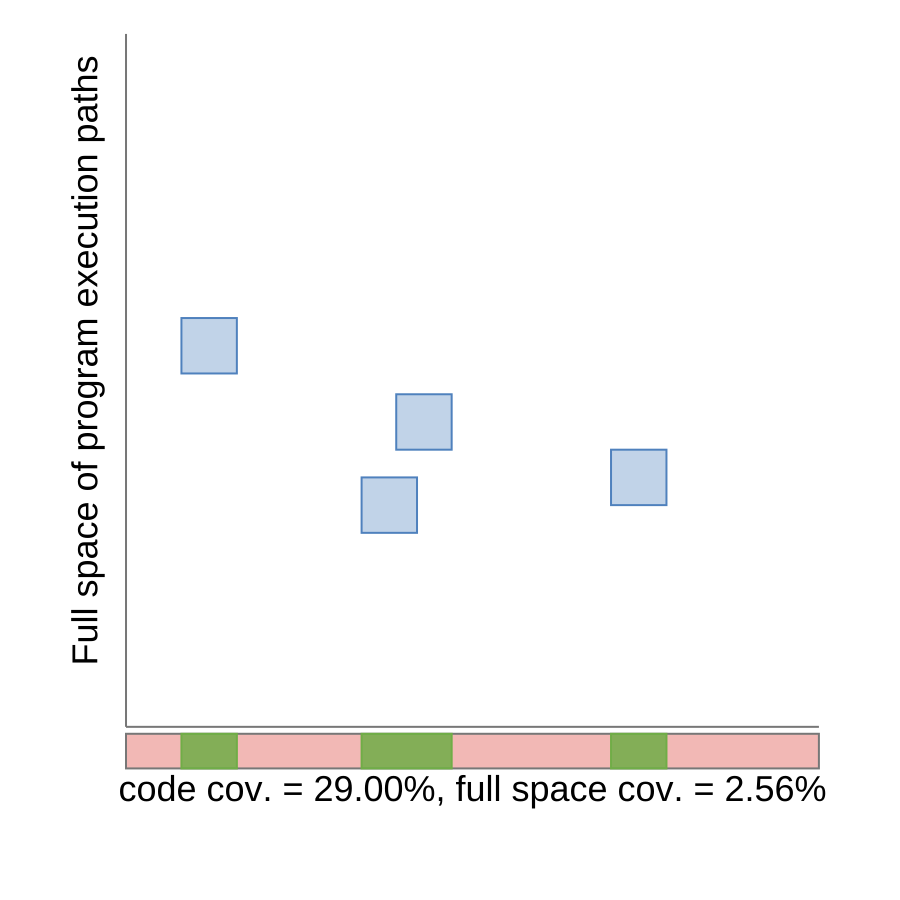
coverage 04
coverage plot 04

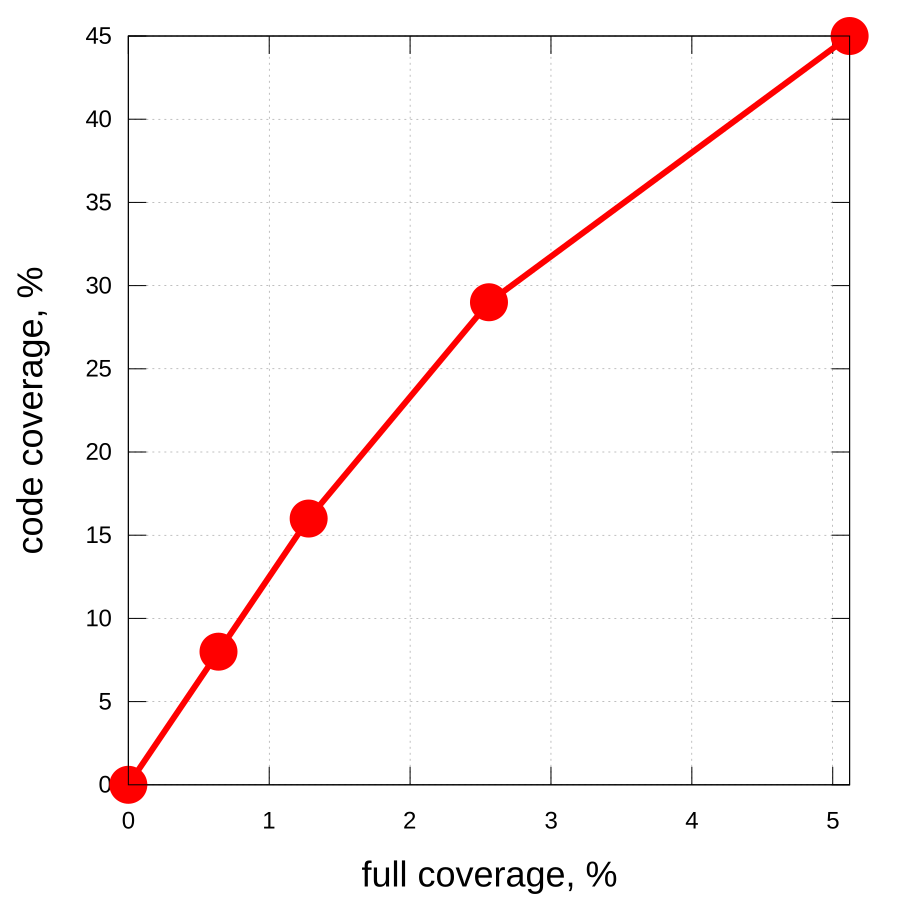
Higher C0/C1 coverage: percentages rise,
but vast areas are untested
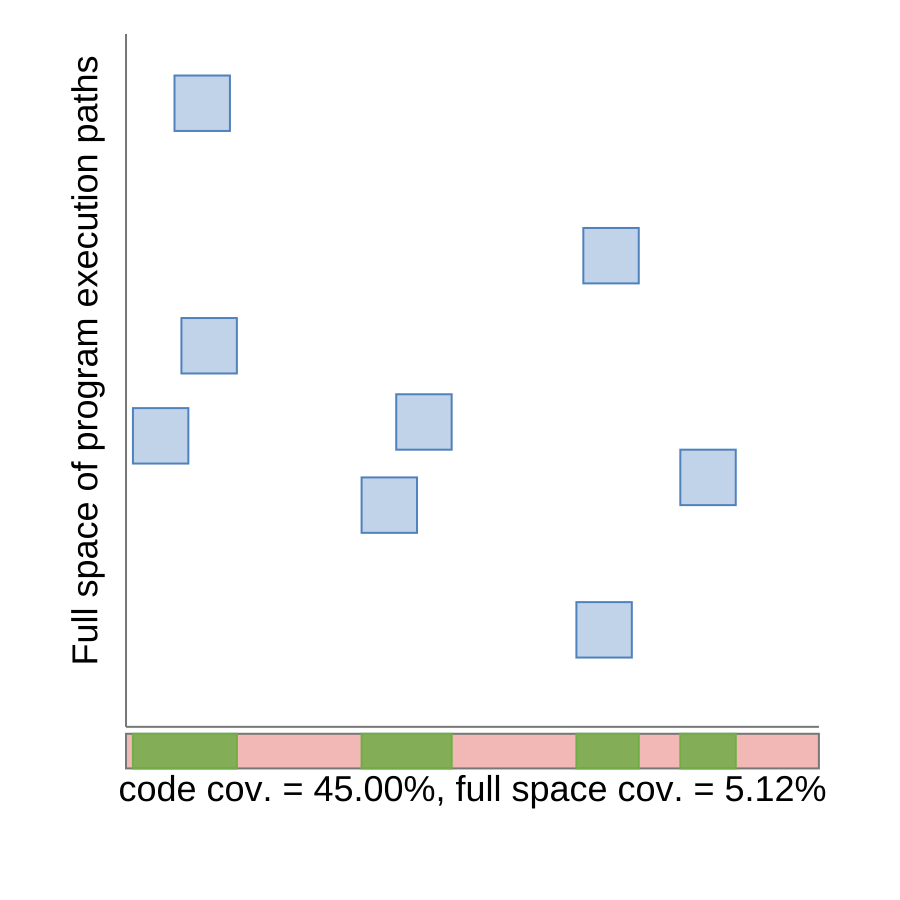
coverage 05
coverage plot 05

Higher C0/C1 coverage: percentages rise,
but vast areas are untested
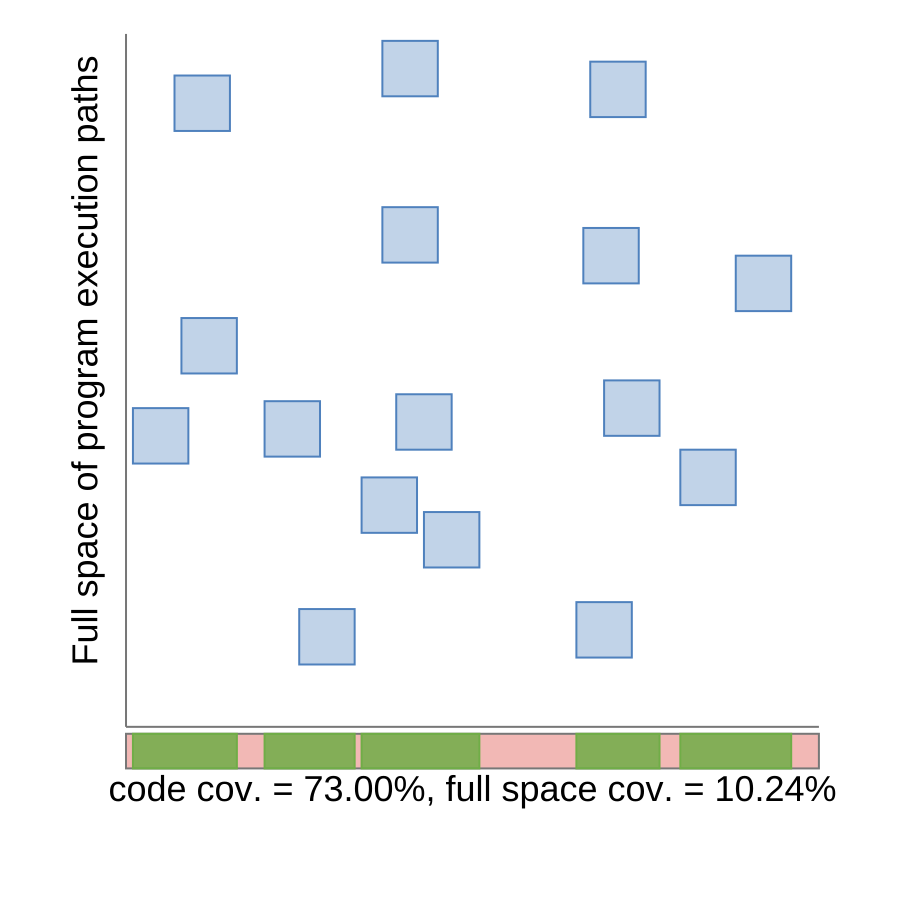
coverage 06
coverage plot 06

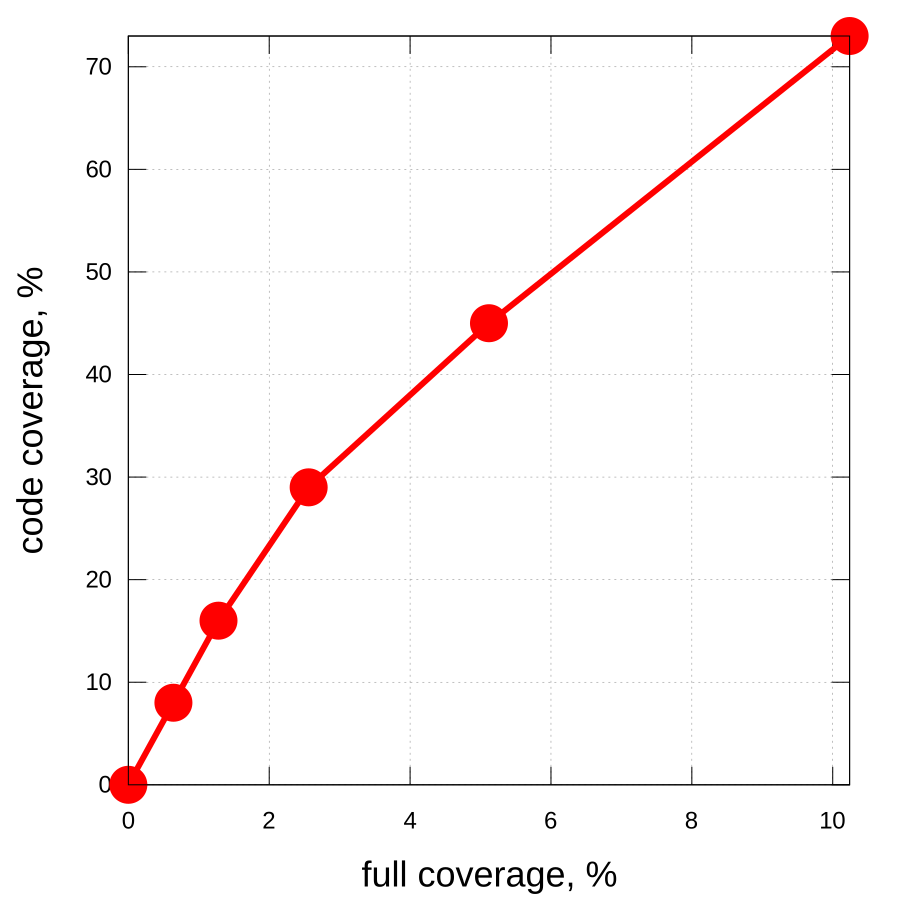
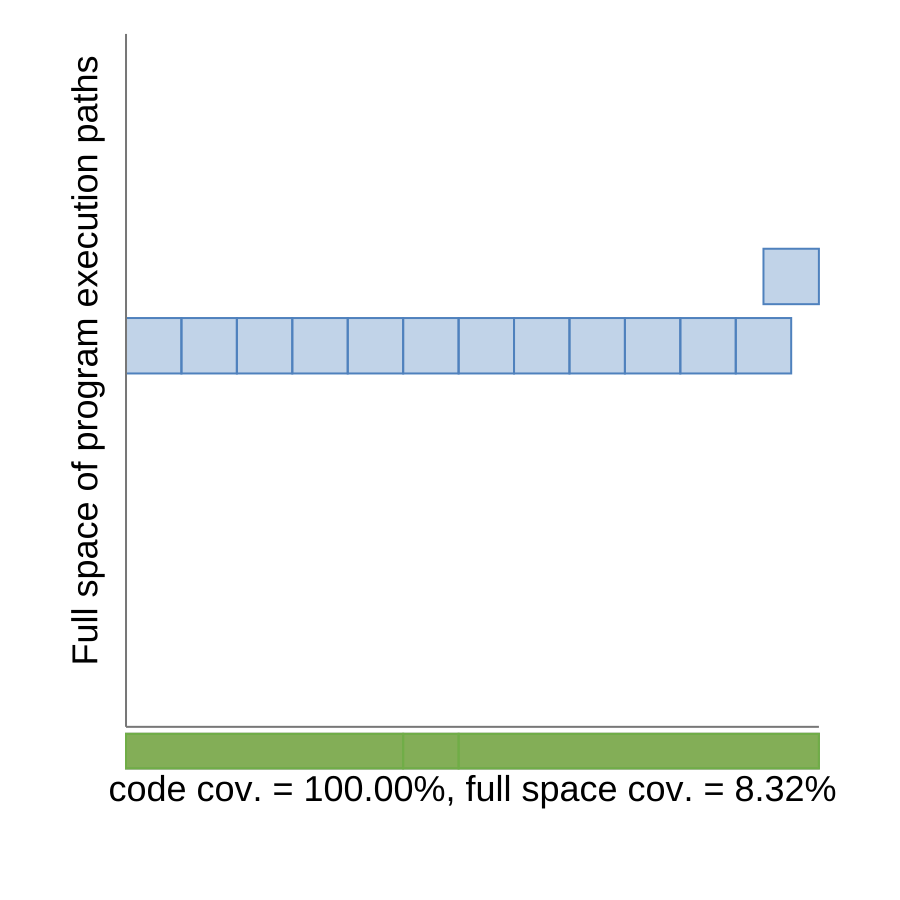
When C0/C1 coverage is high, adding new valuable tests
does not contribute to the metric
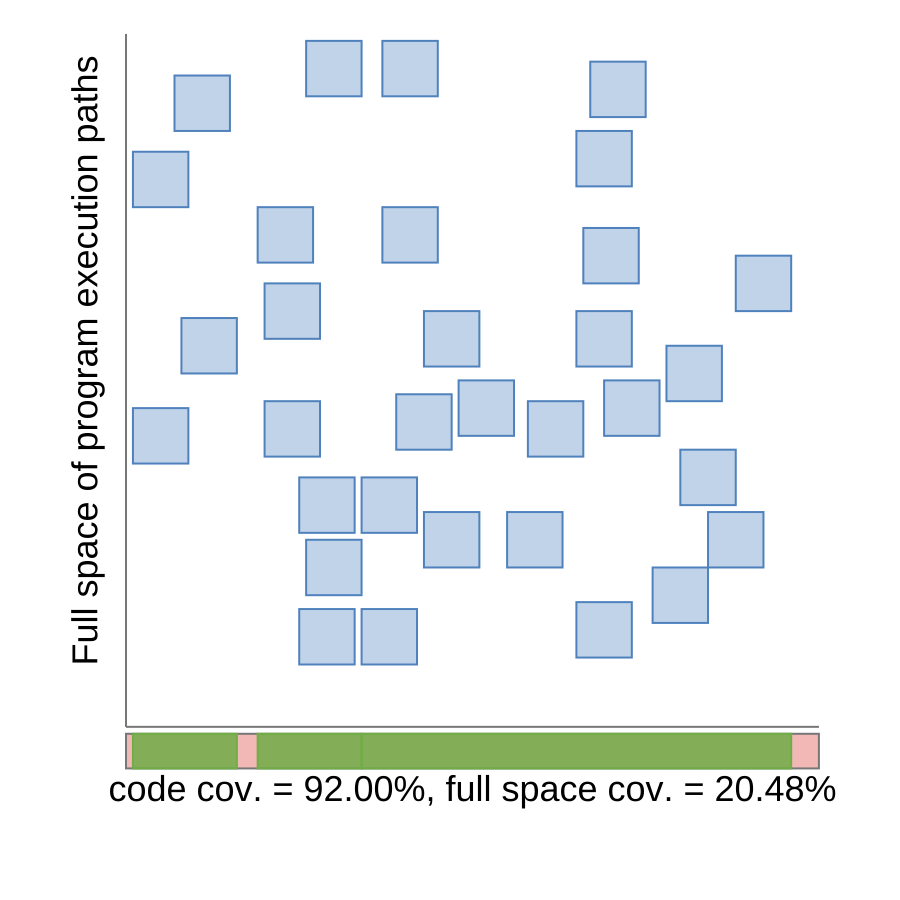
coverage 07
coverage plot 07

Interim conclusion

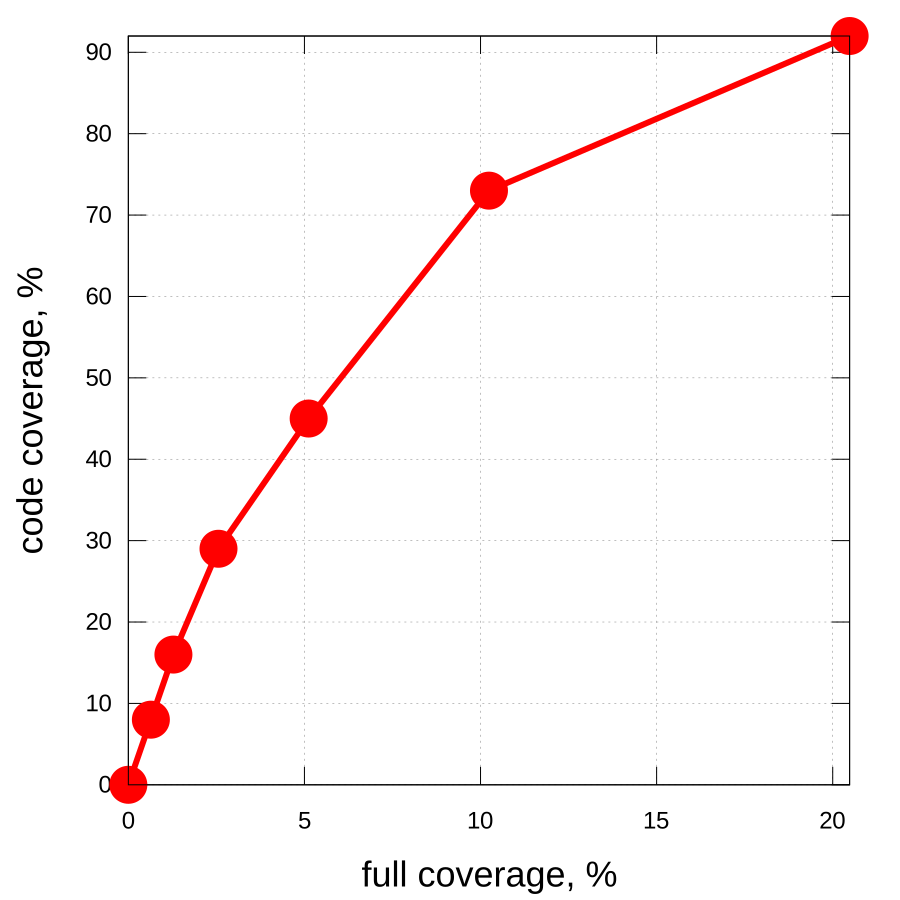
Code coverage is a useful test-quality signal only at low levels.

Beyond the saturation point, much more path coverage
produces only tiny gains in line or branch coverage.
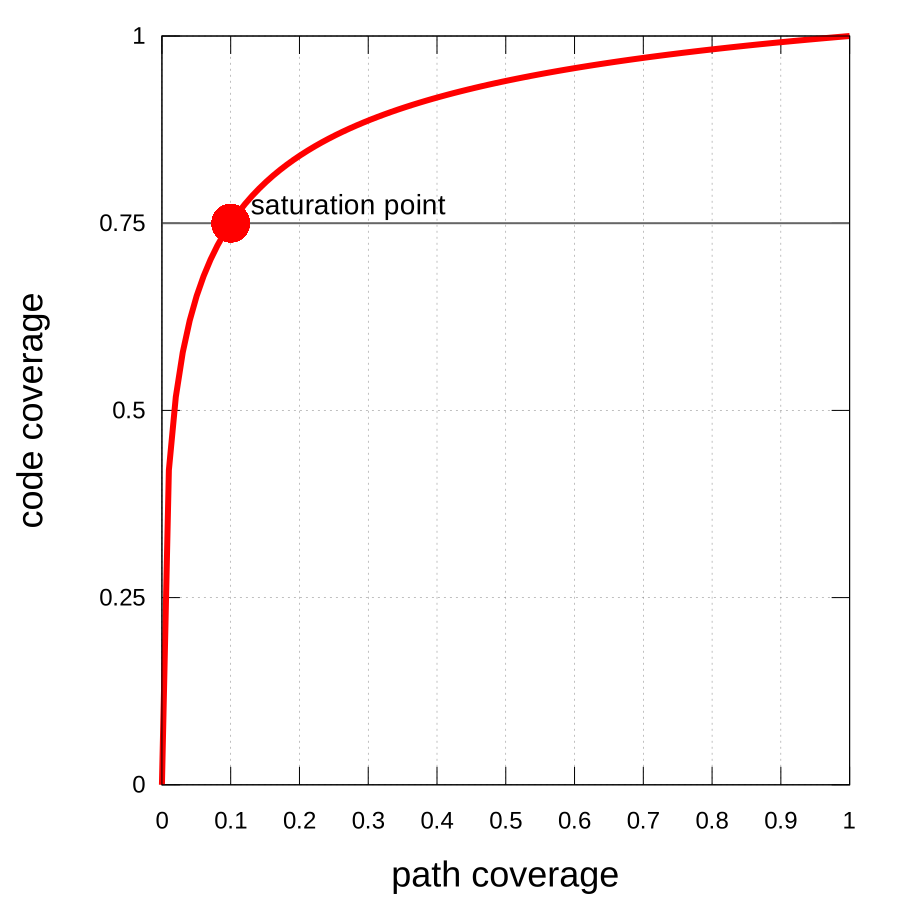
saturation curve

Coverage-tuned code

  • 25% coverage

  switch (v) {
  case A -> doA();
  case B -> doB();
  case C -> doC();
  case D -> doD();
  }
  • 100% coverage

 Map.<Value, Runnable>of(
    Value.A, this::doA,
    Value.B, this::doB,
    Value.C, this::doC,
    Value.D, this::doD).get(v).run();

Lessons learned

  • Setting an overly high code coverage threshold does not lead to real codebase improvement.

  • My suggestion: 75% is the highest reasonable quality gate for branch coverage.

  • Measure unit test and integration test coverage separately, and set separate quality gates for each. Instead of an inflated “combined coverage” number, you get a more accurate picture.

Code is covered, but nothing is tested

  public void doALotOfStuff(){
  doSomething();
  doSomethingElse();
  doAnotherThing();
  doYetAnotherThing();
  }
@Test
void uselessTest() {
  doALotOfStuff();
}
  • We have 100% C0/C1/C2 coverage, CC = 1, but removal of any of these lines (or adding more of them) will not affect the test result.

  • Measuring code coverage does not measure the ability of tests to actually detect faults!

Mutation testing (e.g. PITest for Java)

  • Takes tests and runs them against automatically modified (mutated) versions of code

  • Mutated versions should fail the tests! If test indeed fails, it means that the mutation is killed (which is good), otherwise it means that the mutation is survived (which means that the test has a flaw!)

Examples of mutations

  • Returning constants instead of a computed result

  • Removal of a method call

  • Boolean subexpression → constant true or false

  • +-, */, etc.

  • >>=, ==, and , etc.

  • Variable → another type compatible variable from the same scope

  • etc

mutation

Equivalent mutations

If mutations are generated randomly, it’s possible that mutated code will be semantically equivalent:

  • a + bb + a

  • if (x > y) return x else return yif (x >= y) return x else return y

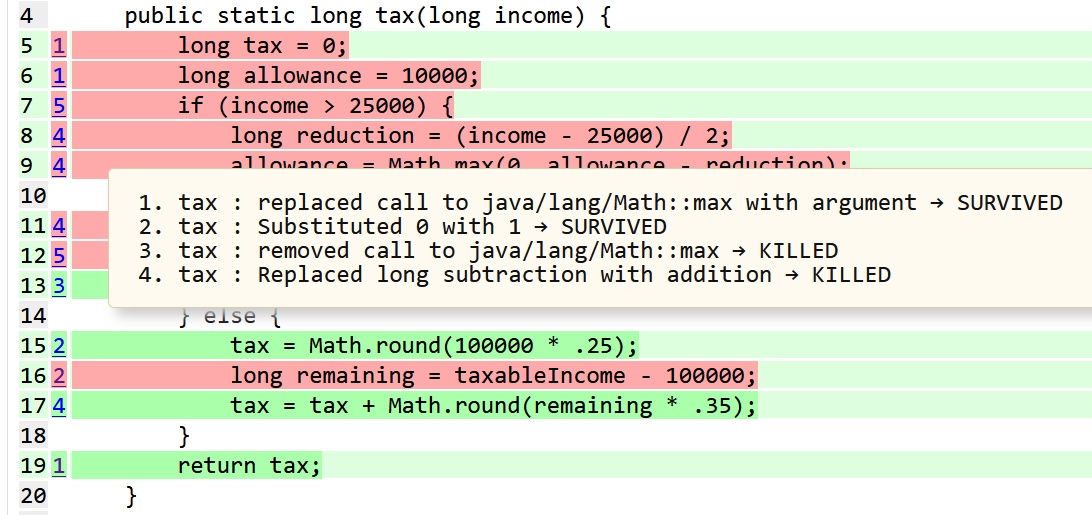
Tax Calculator Mutation Coverage

pitest tax

Tax Calculator Mutation Coverage

long tax;
long allowance = 10000;                     // 10000 → 10001
if (income > 25000) {                       // > → >=, 25000 → 25001
    long reduction = (income - 25000) / 2;  // 25000 → 25001
    allowance = Math.max(0, allowance - reduction);  // 25000 → 1
}
long taxableIncome = Math.max(0, income - allowance); //max → argument, 0 → 1
if (taxableIncome <= 100000) {              // < → <=, 100000 → 100001
    tax = Math.round(taxableIncome * .25);
} else {
    tax = Math.round(100000 * .25);
    long remaining = taxableIncome - 100000; //100000 → 100001
    tax = tax + Math.round(remaining * .35);
}
return tax;

What do mutation tests tell us?

  • Test case for income below allowance worth adding, as well as tests for boundary values.

  • > → >= mutations are equivalent mutations, as tax value is a continuous function, and these are false positives.

Practical problems

  • SLOW with real-life code (2 mins → 40 mins).

  • Equivalent mutations give false-positive "deficiencies".

Modern tools fight both of these problems, the fight goes on
(see, for example, "Jan-Jelle Kester. Stryker: How mutation testing got practical", FOSDEM 2024)

Lessons learned

  • For mission-critical pieces of code, mutation testing provides high level of confidence, as it measures the quality of tests themselves.

  • Mutation testing results should be taken with caution: false positives occur among genuine defects.

  • Mutation testing is slow.

  • In real life, mutation testing is still considered to be impractical and is used quite rarely.

Conclusions

  • In the modern world, both code and tests are cheap,
    and code coverage metric is inflated and devalued.

  • Make it meaningful again: calculate it precisely,
    and reject high but meaningless numbers.

My opinionated practical advice

  • Stop using the C0 “covered lines” metric. Switch to C1 branch coverage today. The numbers will be lower, but more honest.

  • Set a maximum cyclomatic complexity of 15 per method across your codebase.

  • Avoid vanity coverage thresholds of 80% or higher. A practical target is 60–75%.

  • Measure unit test and integration test coverage separately, and set separate quality gates for each.

  • Look at the coverage report, not just the metric. Find potentially risky fragments and apply techniques such as fuzzing and/or mutation testing to critical code.

  • Keep an eye on modern tooling. Practical tools for C2 and mutation coverage are improving, but there is still more to come.

Thanks for listening!

Charles Goodhart’s Law: "Every measure which becomes a target becomes a bad measure"

@inponomarev